Observability
Detailed telemetry is generated for all F5® Distributed Cloud Services. This telemetry provides observability of infrastructure, applications, connectivity, and security services across a distributed environment and allows NetOps, DevOps, and application teams to troubleshoot and optimize their applications without additional burden on application developers.
F5 Distributed Cloud Services collects four types of telemetry data - logs, metrics, alerts, and events. Access logs are sampled regularly, while security events and audit logs are not. However, to protect our system, security events may be sampled in cases of extreme load.
Logs may be used by different operators for a variety of use cases, including determining anomalies, analyzing application APIs, identifying security issues, monitoring resilience, and ensuring optimal performance.
Logs, metrics, alerts, and events are automatically stored by Distributed Cloud Services for each tenant and can be accessed via API. F5 retention policy is set to store each item for the following time periods:
- Security Events: 30 days
- Audit Logs: 30 days
- Request Logs: 7 days
If you need to access logs older than the supported retention period, we recommend using the Global Log Receiver to export logs to SIEM solutions such as Splunk or Datadog, or one of several log collection systems, and store them where it is convenient for you. Logs include all system and application logs from the Regional Edge and Customer Edge.
If you need a storage option from F5, reach out to your F5 contact.
Note: logs and security events sent to external SIEM or storage through GLR are also subject to sampling. Additionally, any logs stored by F5 in long-term storage for up to one year may also be sampled.
For more details on how the features described in this guide work, refer the observability architecture in the Concepts section.
Enable Observability on F5 Distributed Cloud Services
F5 Distributed Cloud Services collects logs, metrics, alerts, and events from our global infrastructure, as well as each of the Distributed Cloud Customer Edge Nodes deployed by users in their on-premises, cloud, and edge locations.
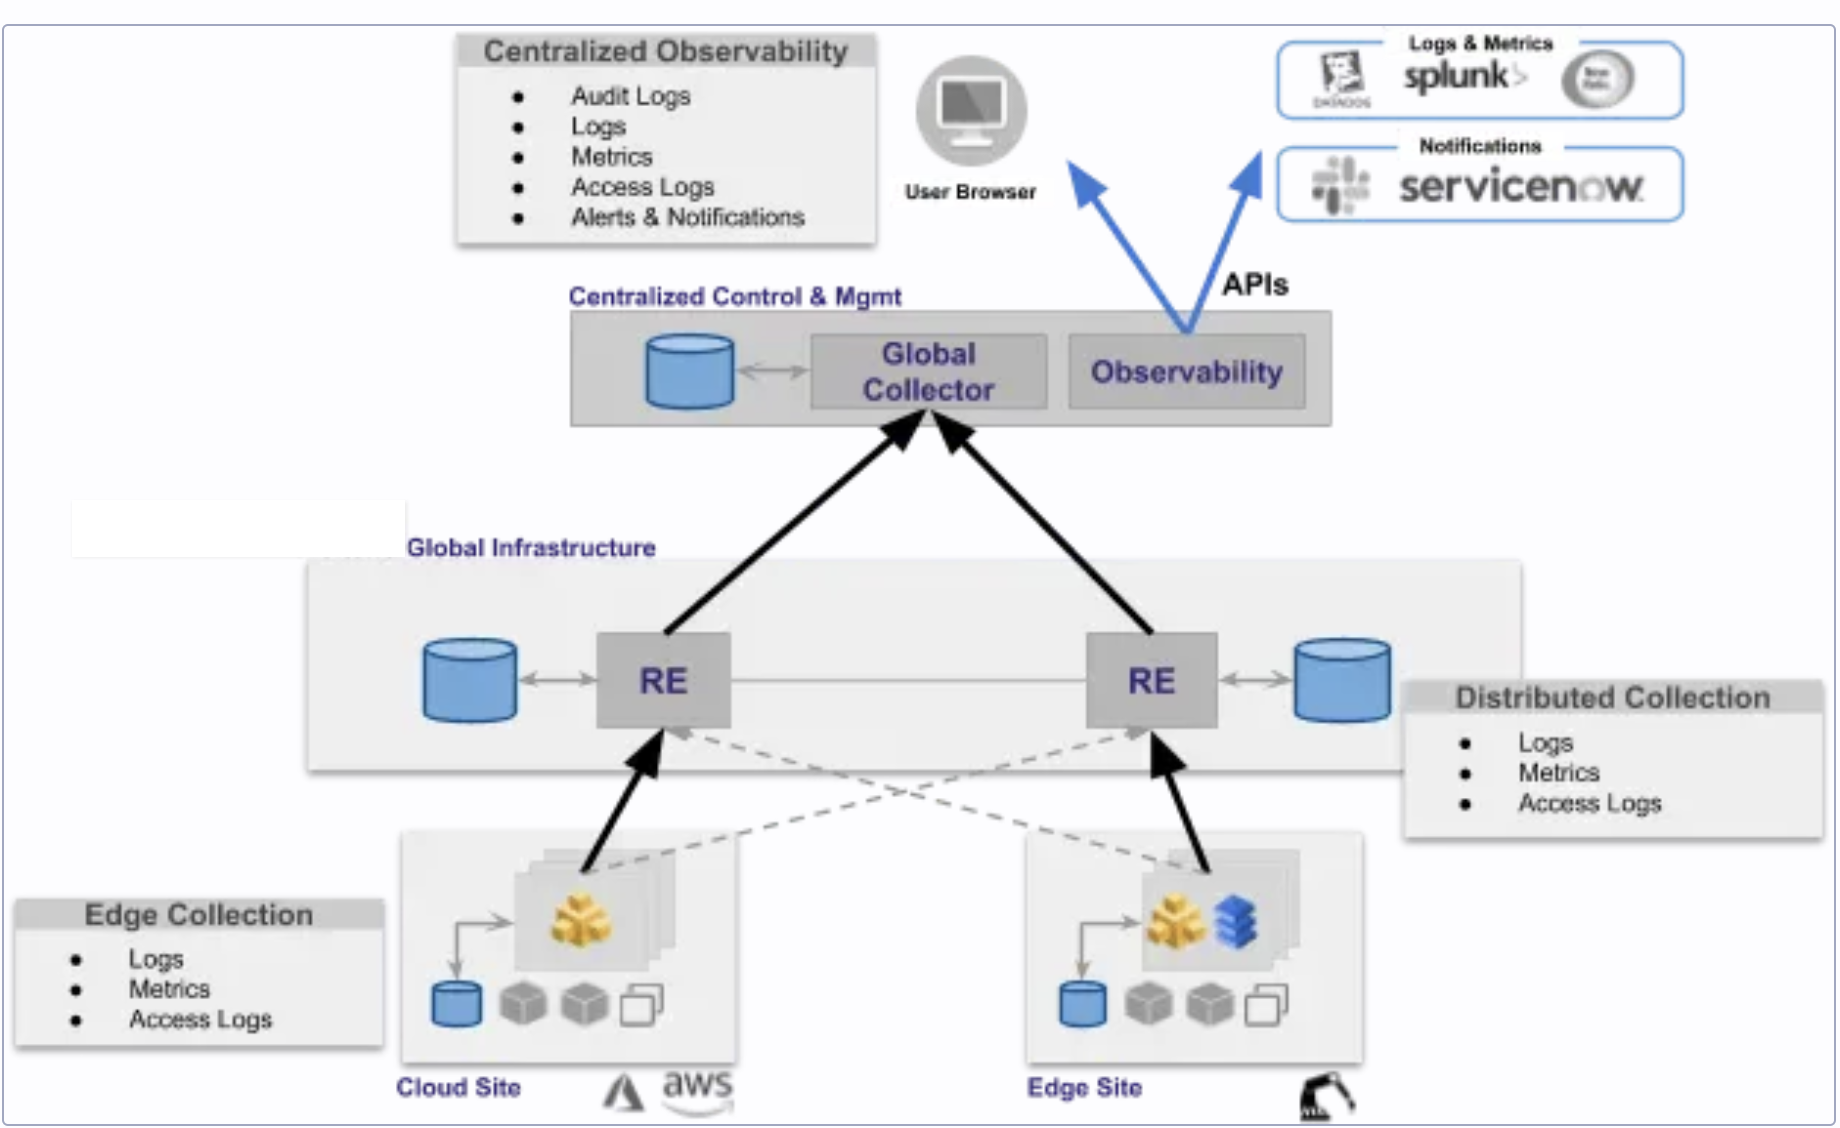
Figure: Highlevel View of Observability System
There are two methods available for customers to get observability into their applications and services:
- Use centralized dashboards within the F5 Distributed Cloud Console.
- Use F5 Distributed Cloud Services APIs to integrate with 3rd party tools.
There are the four different types of telemetry and observability data that is collected from distributed sources and aggregated by the system:
-
Logs - There are three types of logs that are aggregated across the system - system logs, application logs, and access logs (request and response). The applications logs are not automatically stored by the system at this time, so users need to decide how to handle their storage. Access logs are sampled and viewed via the Access & Audit Log API.
-
Metrics - There are many time-series metrics for the Infrastructure (cpu, memory, disk, interfaces, connectivity, and latency), Applications, and Application Services (deployment status, application health, request rate, errors, duration, latency, and throughput) that are collected by the system.
-
Alerts - Alerts can be related to user services (for example, application restart, site connectivity lost, out of memory) or infrastructure services (for example, service restart, connectivity errors). Alerts are available in the dashboard and using the APIs can be integrated to external system like Pagerduty. Some alerts relating to infrastructure services are handled and mitigated automatically by the SRE team, and may be viewed via the Alerts API.
-
Security Events & Audit Logs - These logs record an event relating to access and change of configuration resources. These are security related chronological records that can be used to identify who, when, and what changes to the configuration of an object were made. Security events and audit logs are not typically sampled, and can be viewed via the Security Event API and Access & Audit Log API.
This telemetry data provides different outcomes to different types of users:
-
F5 Distributed Cloud Services Site Reliability Engineers (SRE)- F5 SREs ensure that customer services and F5 global infrastructure are operational and meeting the service level objectives.
-
Customer Operations - Operations teams can use telemetry data for observability of their infrastructure, network, applications, and end-users of their applications. There is a rich amount of visibility available on the F5® Distributed Cloud Console (Console) for instant visualization of this data as well as APIs available that can be used to integrate with other tools.
-
Customer Application Teams - Application teams can use telemetry data to get observability of application and network services that relate to their specific applications.
-
Third Party Integrations - Certain logs and metrics may need to be sent to external systems for compliance, end-to-end visibility, and alerting purposes. Some examples are ServiceNow, Pagerduty, Splunk, NewRelic, Sumologic, and DataDog, and much more. Distributed Cloud Services APIs can be used to integrate most of the commonly used external systems.
Observability data is available to users through the following two mechanisms:
-
Console - Users can access various dashboards and graphs relating to their infrastructure and applications in the F5 Distributed Cloud Console.
- In the Infrastructure (system) namespace, users have access to visualizations like Site Map, Site Connectivity, and Site Dashboard.
- In the respective Application namespaces, users have access to visualizations like Application Sites, Application Deployments, Virtual Host Dashboard, Service Mesh Graph, Security Dashboard, and Application Traffic Graph.
-
APIs - There are APIs to collect infrastructure and application logs, metrics, alerts, and events. In addition, there is a graph query API that provides metrics for interactions across services. These APIs can be used to interface with external systems like Splunk or Datadog.
Concepts
The following concepts are used for the observability features. Click on each one to learn more: